S3000 HTML Support
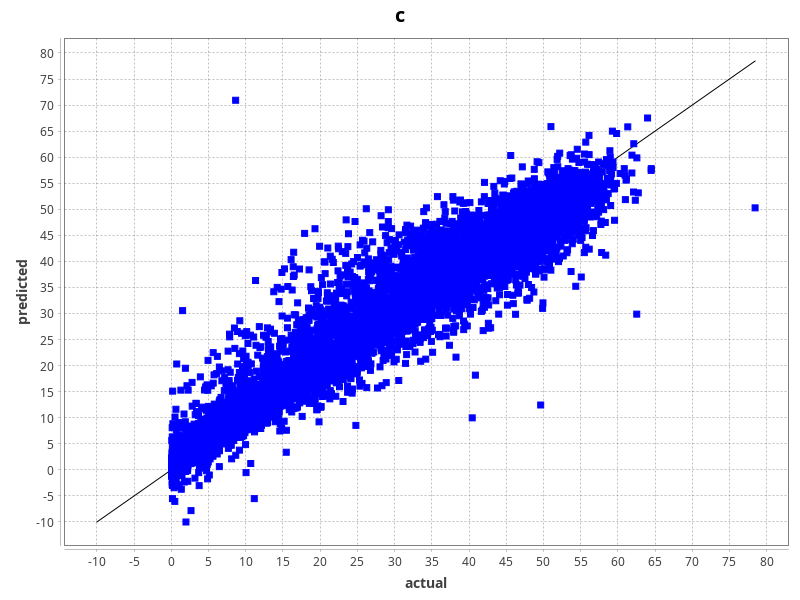
During training runs, our commercial framework for laboratories, S3000, can output cross-validation statistics, which include summary statistics, spreadsheets and plots. Up till now, the plots were PNG image files, making it easy to include them in reports or quickly scan the model performances.
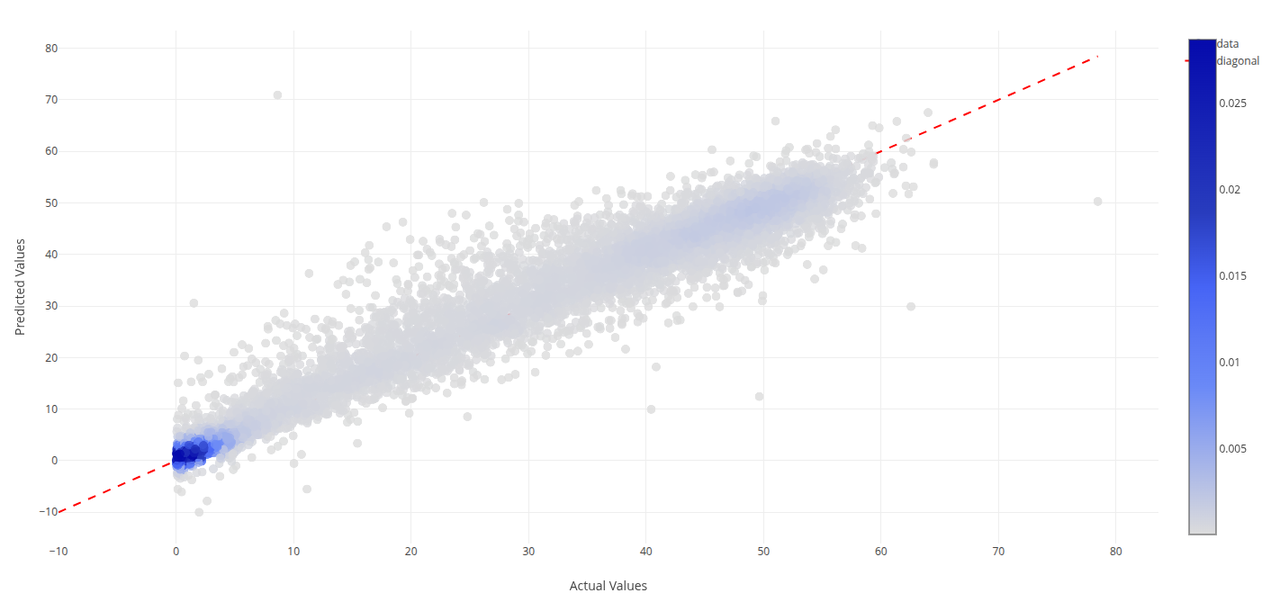
A while ago, support for kernel-density estimate (KDE) plots was introduced, which can tell a better story for datasets with a lot of data points. The default scatter plot for actual vs predicted can be replaced using the ConfigTags.props file, e.g., with this KDE setup:
output_model_statistics#chart=adams.gui.visualization.jfreechart.chart.DensityScatterPlot -label-x actual -label-y predicted -mode KDE -generator "adams.gui.visualization.core.BiColorGenerator -first-color #0000ff -second-color #ffc800 -alpha 127"
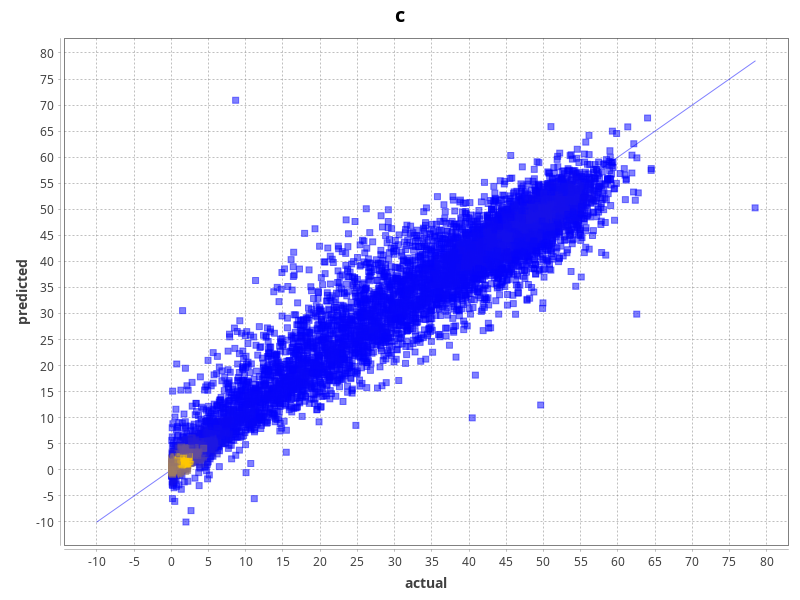
However, static plots make it easy to spot outliers, but much harder to identify them. ADAMS introduced the generation of self-contained HTML plots in the WEKA Investigator, which can now be used in S3000 as well when outputting model statistics. The following ConfigTags.props entry will
output_model_statistics#html=adams.flow.transformer.actualvspredictedprocessor.ClassifierErrorsKernelDensityEstimate -circle-size 10