Paddle
Requirements#
Paddle support requires the image-dataset-converter-paddle library.
Image classification#
With the following command, a sub-dir structured is converted into Paddle
format. The integer ID/label text mapping is stored in ./paddle/labels.map,
the label ID/file mapping in files.txt and the images are stored relatively
to the output directory in the jpg sub-directory:
idc-convert -l INFO \
  from-subdir-ic \
    -l INFO \
    -i ./subdir \
  to-paddle-ic \
    -l INFO \
    -o ./paddle \
    --id_label_map ./paddle/labels.map \
    --file_label_map files.txt \
    --relative_path jpg
The following converts all Paddle .txt files with image/label definitions
back into sub-directory format:
idc-convert -l INFO \
  from-paddle-ic \
    -l INFO \
    -i ./paddle/*.txt \
    -m ./paddle/label_list.map \
  to-subdir-ic \
    -l INFO \
    -o ./subdir/
Image segmentation#
The following converts indexed PNGs into Paddle's image segmentation format:
idc-convert -l INFO \
  from-indexed-png-is \
    -l INFO \
    -i ./indexed/*.png \
    --labels l1 l2 l3 l4 \
  to-paddle-is \
    -l INFO \
    -o ./paddle
And this command converts the Paddle format into indexed PNGs again:
idc-convert -l INFO \
  from-paddle-is \
    -l INFO \
    -i ./paddle/*_list.txt \
    --labels_file ./paddle/labels.txt \
  to-indexed-png-is \
    -l INFO \
    -o ./indexed
Plotting VisualDL log files#
When building, e.g., image segmentation models, Paddle can output the progress
in VisualDL log files. Typically,
these are visualized with the visualdl binary and viewed in the browser.
When this is not an option, e.g., when in a headless environment on a server,
then you can still generate simple text-based plots in the terminal via
the to-terminal-plot writer of the kasperl-plots
library.
This command plots a log file in the terminal and exits:
idc-convert \
    from-visualdl \
      -l INFO \
      -i "./logs/*.log" \
      -c scalar \
      -t "Evaluate/mIoU" \
    to-terminal-plot
The example pipeline below monitors the ./logs/ directory for any
modifications to .log files. It then reads the modified file using the
from-visualdl reader, generating a plot for the Evaluate/mIoU scalar
(use the idc-visualdl-info tool to inspect VisualDL log files) and
displays it using to-terminal-plot:
idc-convert \
    watch-dir \
      -i "./logs/" \
      -e ".log" \
      -E modified \
      -a nothing \
      -p never \
      -w 5 \
      -b "from-visualdl -l INFO -c scalar -t Evaluate/mIoU" \
    to-terminal-plot
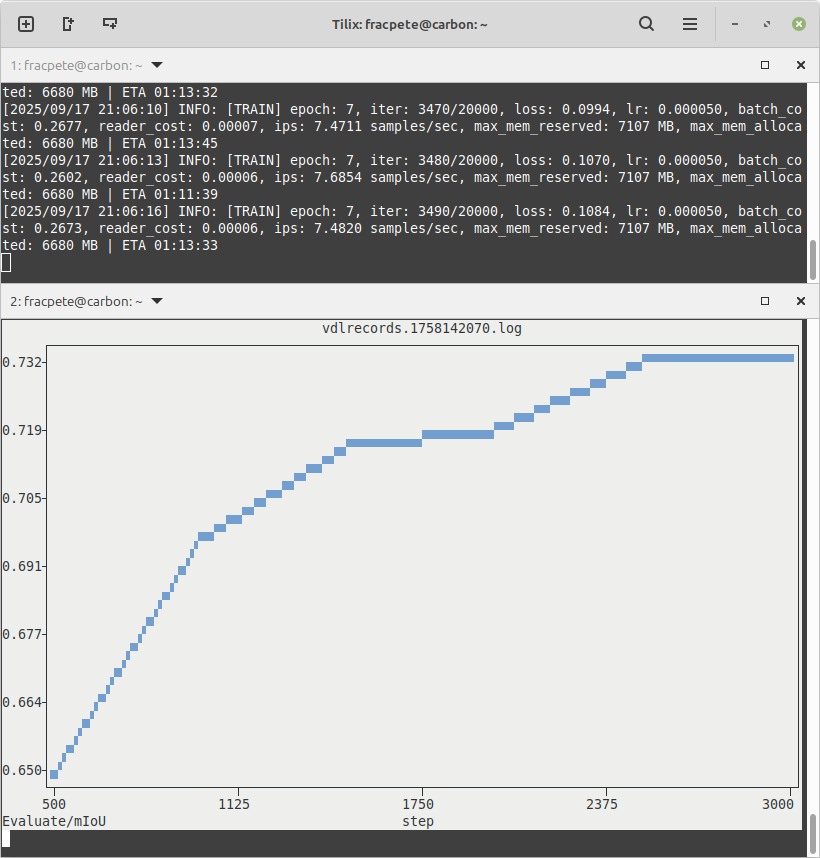
Below is a screenshot with two terminal sessions, one training a PaddleSeg model, and the other one monitoring/plotting the log file of the training run:
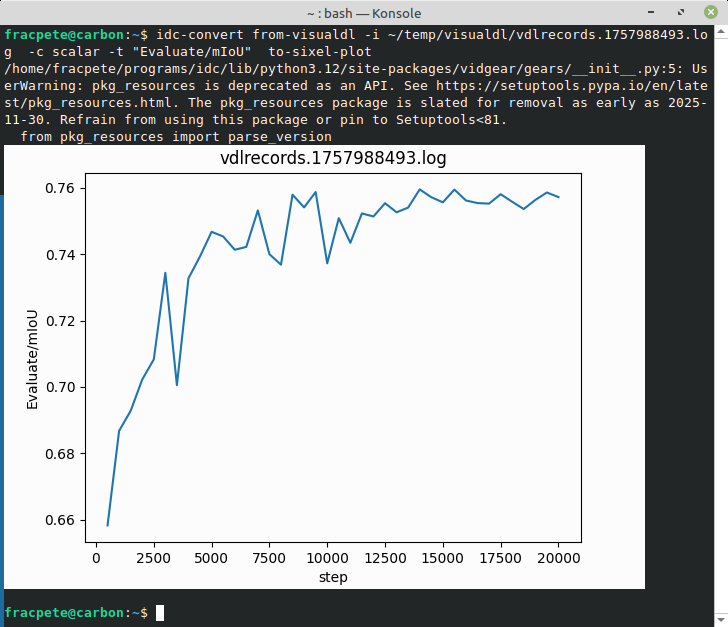
If you have a terminal that supports sixel
(check www.arewesixelyet.com for compatibility),
like KDE's Konsole, then you can use the to-sixel-plot
writer to generate nice-looking graphs like this one: